How to draw sine wave in Matlab 7.0
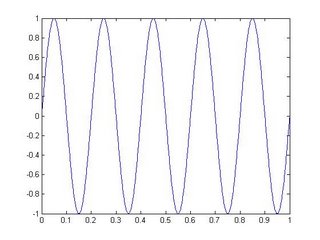
Here i'm with the most basics fo matlab.The question might be rising in your minds that what is sine or cos wave? ..the answer to this question would be like that the sine wave is a sinusoidal wave having the shape as shown in the below figure...In electrical technology we transmit the singnal in the form of sine,cos or tan wave..our new modern techology in pakistan termed as Gsm is based on these kind of signals ...now five mobile companies are working in pakistan named as mobilink,telenor,paktel,ufone and warid,the technology is based on signals transmitting and receiving which is done by these kind of sinosoids signals.Here in pakistan 2.5G (2.5 generation)...which has gprs along with the other feature ,the companies which does not allows gprs are having 2.0G..the most modern is the 3.0G which support video conferencing and thats used in some Europe countries...For third generation there must be a compatible cell phone which support the 3g.
Coding for sine wave in Matlab
t=0:0.001:1;
y=sin(2*5*pi*t)
plot(t,y)
Sine wave


5 Comments:
i think these are very useful for beginners like me.:)
do u have any code for frequency modulation? plzz help me
i think...
set your amplitude on the high frequency as another sine wave of lower frequency instead of the usual constant A.
x =A sin(2.pi.f.t)
replace constant A with f sine wave, i.e. multiply them together.
???
%modulate x and x2, is this right for you ?
t=0:0.001:1;
f = 1.2;
x = sin(2*pi*f*t);
x2 = sin(2*pi*f*t*100); %freq * 100
xmod = x2.*x;
%plot xmod and see
hi how can make 2 dimensional analog signal by using sine function
when this code is run in Matlab it gives a sine wave..no doubt about it but when you increase its frequency upto a higher values the sine signal gets distorted...so i wanna a code in such a way that it works at any kind of frequency values...
Post a Comment
<< Home